
MarketStats

✔ Included with your Stellar MLS subscription
Launching Soon
ShowingTime's in Depth Analytics Tools
ShowingTime’s in-depth, interactive market analytics tools change the way real estate pros use and share housing information. From area comparisons to customizable variables to trend analysis and geographies you’ll love the simplicity of your MarketStats suite!
Your subscription to MarketStats is included in your Stellar MLS subscription and gives you access to both InfoSparks and FastStats.
Get Ready With MarketStats Training
Get familiar with MarketStats by ShowingTime through one of our upcoming training sessions. You’ll explore key features, learn how to use InfoSparks and FastStats, and discover ways these tools can support your business.
Choose the date and time that works best for you and register using the links below.
- Wednesday, September 9, 2026, at 1 p.m. ET
- Thursday, September 10, 2026, at 10 a.m. ET

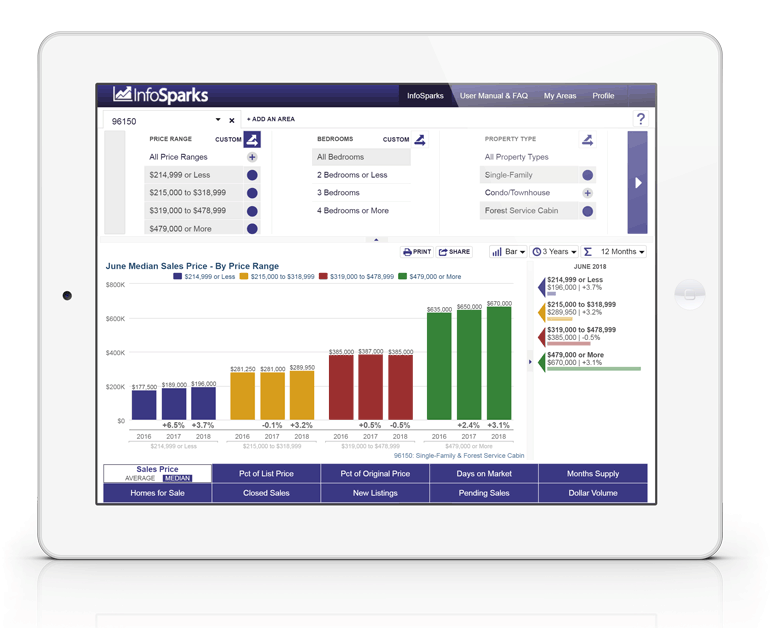
Compare Geographies: Compare up to four geographies by a variety of housing variables, market metrics and time calculations.
Analyze Data: Investigate important market metrics by county, city, postal code, neighborhood and other geographies.
Share or Store: Embed personalized charts on blogs, websites and social media profiles so they’re always up to date, or download raw data to create your own branded charts for marketing purposes.

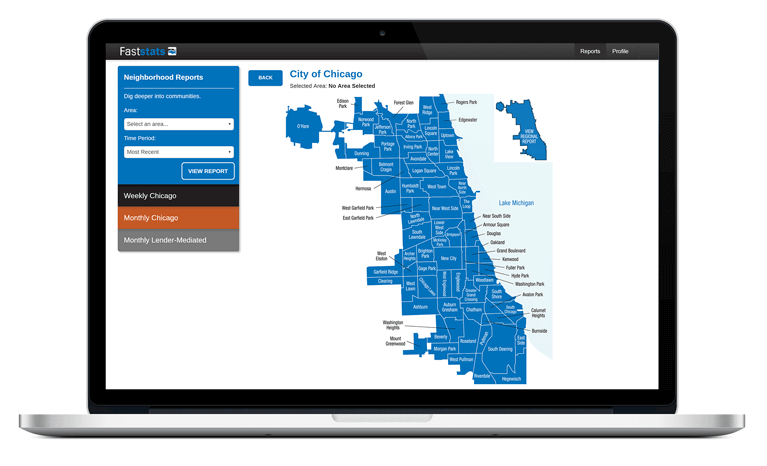
Interactive Maps: Clean and visible maps of local housing stats in a sleek, intuitive, easy-to-use modern interface.
Deep Data: Create detailed one-page market reports for any type of geographic area.
Complete Picture: Get a complete picture with reports on metrics, supply, foreclosures and more.
Get Started
To access InfoSparks or FastStats, log in to Stellar Central®. Underneath the Products & Services tab, click the "Stellar Products." Scroll to find MarketStats and click "Access this tool."
FAQs
What are InfoSparks and FastStats?
InfoSparks is an interactive market-analysis tool for exploring trends, comparisons, charts, and maps. FastStats provides ready-to-use market reports and data summaries. Both help members understand local housing-market activity using MLS data.
How do I access InfoSparks or FastStats?
Log in to your MLS and look for the MarketStats link. If you do not see the link, contact your MLS or association to confirm that your account has access.
How often is the data updated?
InfoSparks data is typically updated nightly through the end of the prior month. The data for your FastStats reports will be pulled on the 8th calendar day and posted to your FastStats interface on the 13th calendar day of each month (unless it falls on a weekend or holiday, then the data will be pulled and/or your reports will be delivered on the following business day.)
Why do the numbers in InfoSparks not match my MLS search exactly?
Results can differ because InfoSparks and FastStats use defined reporting rules, date ranges, status logic, and data-cleaning processes. Confirm that your geography, property type, date range, and filters match before comparing results, and even then the calculation may not be exact, but it should be relatively close.
Can I compare more than one area?
Yes. In InfoSparks, you can compare up to four geographies across a variety of market metrics and time periods, depending on your MLS configuration.
Can I filter by property type, price range, bedrooms, or other criteria?
Yes. InfoSparks offers filters that may include property type, price range, bedrooms, bathrooms, square footage, property type, and construction type.
Can I create a custom area or map?
InfoSparks allows users to explore available geographies and, where enabled, create customized map areas. If a geography or feature is unavailable, check with your MLS or association for guidance.
Can I share an InfoSparks chart with clients or on social media?
Yes. You can share charts and market insights with clients, and may be able to embed charts on websites or social channels. Keep the source information attached to any market data you publish or distribute.
Can I add my name, headshot, company name, or contact information to a chart?
Yes. InfoSparks includes branding options for customizing market charts with your professional information. This is a useful way to turn market data into client-ready content.
How do I download the numbers behind a chart?
Use the sharing or export options available in InfoSparks to download data when enabled. The options you see may differ based on your MLS setup and the chart you are viewing.
Why can’t I see data for a specific area?
The selected entity may not have reportable activity for your chosen period, may not be available in the current data feed, or may be excluded by the filters you have selected. Try broadening your date range or filters, then contact your MLS if the issue continues.
What should I do if a chart or report appears blank?
First, confirm that you selected a geography, time range, and property type with available data. Then refresh the page, clear browser cache if needed, and try a supported, up-to-date browser. If the problem persists, capture a screenshot and contact your MLS or association.
Why can’t I log in or why does the system not recognize me?
Access is often connected to your MLS credentials and account status. Log out and back into your MLS, then open InfoSparks or FastStats from the MLS link. If you still cannot access the tools, contact your MLS or association to verify your account and permissions.
Can I use the reports and charts in a listing presentation or newsletter?
Yes. InfoSparks and FastStats are designed to help you communicate local market trends. Use clear context, select the appropriate geography and time frame, and include the required source attribution when sharing market information.
Who should I contact for help?
For access, data, or report questions, start with your MLS or association. You can also review the User Manual and FAQs available within InfoSparks, where provided.
